A common mistake we see in Chandler is assuming that standard soil borings alone are enough to characterize the subsurface for large commercial or multi-family projects. The basin fill here is heterogeneous — ancient river deposits from the Salt River system create rapid lateral changes in density and stiffness. A boring spaced 50 feet apart can miss a paleochannel filled with loose sand while the adjacent column sits on competent gravel. Seismic tomography fills that gap. By deploying a dense array of geophones and generating a P-wave and S-wave velocity profile, we map those hidden velocity contrasts before the foundation design is set. We often run this in tandem with resistivity surveys to cross-check anomalies in conductive clay lenses versus dry alluvium. The result is a 3D picture of the ground that a dozen borings alone cannot provide.
A single seismic line can reveal a velocity inversion or hidden fault that changes the entire foundation strategy — cheaper than underpinning later.
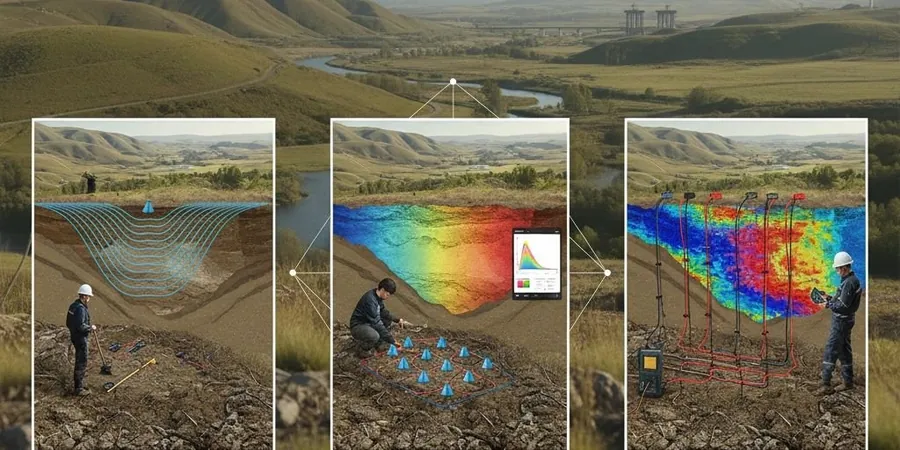
Methodology and scope
Local considerations
Chandler’s rapid suburban expansion since the 1990s pushed development onto former agricultural land and undisturbed alluvial fans. We see it frequently: a developer buys a parcel that looks flat and uniform from the surface, but the subsurface contains buried stream channels, old irrigation ditches filled with loose material, or zones of cemented caliche that create hard spots. A foundation designed without seismic tomography may settle unevenly or, worse, experience differential movement during a moderate earthquake. The 1887 Sonoran earthquake (M 7.2) demonstrated that even distant seismic events can cause liquefaction and ground cracking in the Phoenix basin. We use seismic tomography to identify those high-risk zones before the slab is poured.
Applicable standards
ASCE 7-22 — Minimum Design Loads (Site Class determination via VS30), ASTM D5777-18 — Standard Guide for Using the Seismic Refraction Method, ASTM D7128-18 — Standard Guide for Using the Seismic Reflection Method
Associated technical services
Refraction Tomography (P-wave / S-wave)
Designed for depth-to-bedrock and rippability assessments. We deploy a linear array of 24–48 geophones with shots at offsets up to 300 feet. The inversion produces a 2D velocity model that identifies layers, cavities, and velocity inversions. Ideal for Chandler sites where bedrock may be 50 to 150 feet deep beneath alluvial fill.
Reflection Imaging (High-resolution P-wave)
Used when the target is a specific reflector — a fault plane, a paleochannel boundary, or the top of a cemented caliche layer. We use a shorter geophone spacing (2–5 ft) and a higher-frequency source to resolve features as thin as 2–3 feet. This method is preferred for Chandler’s older subdivisions where previous grading may have created undocumented fill pockets.
Typical parameters
Frequently asked questions
How deep can seismic tomography see in Chandler’s alluvial soils?
With a 48-geophone array at 10-foot spacing and a 400-pound accelerated weight drop, we routinely image to depths of 120–150 feet. In dry alluvium with low attenuation, we have reached 180 feet. The actual depth depends on surface conditions, source energy, and the velocity contrast between layers.
What is the cost range for a seismic tomography survey in Chandler?
For a typical residential or commercial lot with a single 2D line (24–48 geophones), the cost ranges from US$2,840 to US$5,340 depending on line length, number of shot points, and reporting detail. Multi-line 3D surveys are priced per line. Contact us for a site-specific quote.
How does seismic tomography differ from MASW for site classification?
MASW (Multichannel Analysis of Surface Waves) uses surface-wave dispersion to derive an S-wave velocity profile. Seismic refraction and reflection tomography use body waves (P and S) to build a velocity model. Both yield VS30 for ASCE 7 site class. We often run refraction tomography and MASW together — refraction gives better P-wave velocity for rippability, while MASW provides the shear-wave profile required for seismic design.