Soil behavior under earthquake loading differs dramatically between Chandler's older alluvial fans near the Santan Mountains and the younger basin-fill deposits closer to downtown. The contrast matters. In the southeast, gravelly sands with higher shear-wave velocities predominate. Near the city center, deeper deposits of silty sands and clays create a softer profile. We run site response analysis for both settings to capture how each stratum amplifies or attenuates ground motion. Without this evaluation, a structure designed for stiff soil may be under-designed on softer ground. The analysis feeds directly into the microzonificación sísmica framework we use to map hazard zones across Maricopa County.
A site response analysis in Chandler can shift the design spectral acceleration by 30% compared to the code-default NEHRP map.
Methodology and scope
Local considerations
Chandler expanded rapidly from farmland into a suburban hub. That agricultural past left compressible topsoils and shallow groundwater in some tracts. Combined with the region's seismic exposure — the city sits within 40 miles of the San Andreas fault system — the risk of site amplification is real. Older subdivisions built without modern geotechnical input may sit on undocumented soft layers. We address this by running site response analysis that incorporates local shear-wave velocity profiles, not generic NEHRP maps. The result is a site-specific acceleration response spectrum.
Applicable standards
ASCE 7-22 (site classification and response spectra), NEHRP Recommended Seismic Provisions (FEMA P-1050), ASTM D4428/D4428M-07 (crosshole seismic testing)
Associated technical services
1D Equivalent-Linear Site Response (SHAKE-based)
We model the soil column using 3 to 6 layers defined by VS30 and modulus reduction curves. Output includes acceleration response spectra at surface and bedrock. Suitable for commercial structures up to 4 stories.
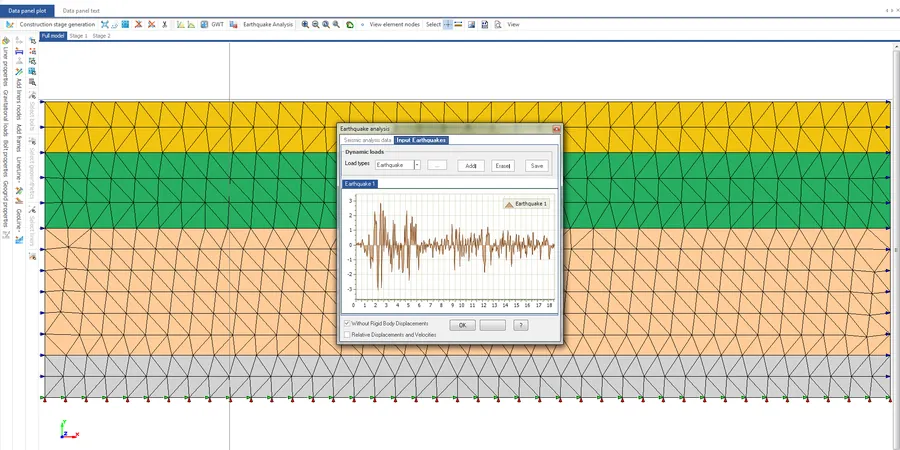
2D Nonlinear Site Response (FLAC / OpenSees)
For critical facilities or irregular topographies near the Santan foothills. We account for basin-edge effects and soil nonlinearity under strong shaking. Includes contour maps of PGA and spectral acceleration.
VS30 Assessment via MASW or ReMi
When a project only needs the NEHRP site class, we run a 1-day surface-wave survey. Deliverable is the VS30 profile and site class letter. Ideal for low-rise residential or preliminary design phases.
Typical parameters
Frequently asked questions
What is the difference between a site response analysis and a standard seismic hazard study?
A seismic hazard study provides the ground motion at bedrock from regional faults. A site response analysis propagates that motion through the local soil column to predict the actual shaking at the surface. In Chandler, the difference can be significant due to the thick basin fill.
How long does a site response analysis take for a typical Chandler project?
Field work requires one day for MASW or ReMi surveying. Laboratory processing and report writing take an additional 5 to 7 business days. Turnaround time is about 2 weeks from field mobilization to deliverable.
Do I need a site response analysis for a single-family home in Chandler?
The 2024 IBC requires site-specific ground motion for Risk Category IV structures. For standard homes, the code allows the use of NEHRP site class maps. However, if your lot is on undocumented fill or near the Santan fault, we recommend a VS30 assessment to verify the site class.
What is the cost range for a site response analysis in Chandler?
The cost typically ranges between US$1,200 and US$3,670 depending on the complexity of the soil profile and the analysis method. A basic VS30-only assessment is at the lower end, while a full 2D nonlinear analysis is at the higher end.